The clinical problem
When a patient with MDS or AML is found to carry a germline variant, the first question is whether that variant explains the disease, because the answer changes donor selection, family screening and surveillance. For variants that alter a protein, laboratories have decades of rules to lean on. For variants that sit outside the coding sequence, in promoters, 5′ untranslated regions and enhancers, they have very little. Most are reported as “uncertain significance” and stay that way.
Two predisposition syndromes show why this matters:
- ANKRD26-related thrombocytopenia. Single-base changes in a short stretch of the ANKRD26 5′UTR cause lifelong thrombocytopenia and a raised risk of myeloid neoplasms. The variants break a silencer, so the gene is not switched off as megakaryocytes mature.
- GATA2 deficiency. Variants in an enhancer inside intron 4 of GATA2 reduce expression of the gene in blood stem and progenitor cells, producing the same syndrome as coding mutations: cytopenias, immunodeficiency, and MDS/AML, often in young adults.
In both, the causal variants are non-coding, the mechanism is understood, and the direction of effect is opposite. That makes them a fair test for a model that claims to predict what regulatory DNA does.
What we did
AlphaGenome 2 (Google DeepMind, November 2026) predicts gene expression from DNA sequence in a specified cell type. It can be conditioned on single-cell RNA data, so the same variant can be scored in different cells.
We asked a narrow question: At the regulatory elements where the answer is already known, does the model find the pathogenic variants, get the direction right, and place the effect in a sensible cell type?
- We scored every possible single-base change: 120 in the ANKRD26 5′UTR and 300 in the GATA2 enhancer. Nothing was hand-picked.
- Truth labels came from ClinVar, which reflects family segregation and reporter assays, not the model.
- The model was conditioned on three bone-marrow cell populations from a public atlas: stem/progenitor cells, megakaryocytes and monocytes.
- The expected directions, the cell types and the pass thresholds were written down before any variant was scored.
Result 1: the known variants land where the biology says they should
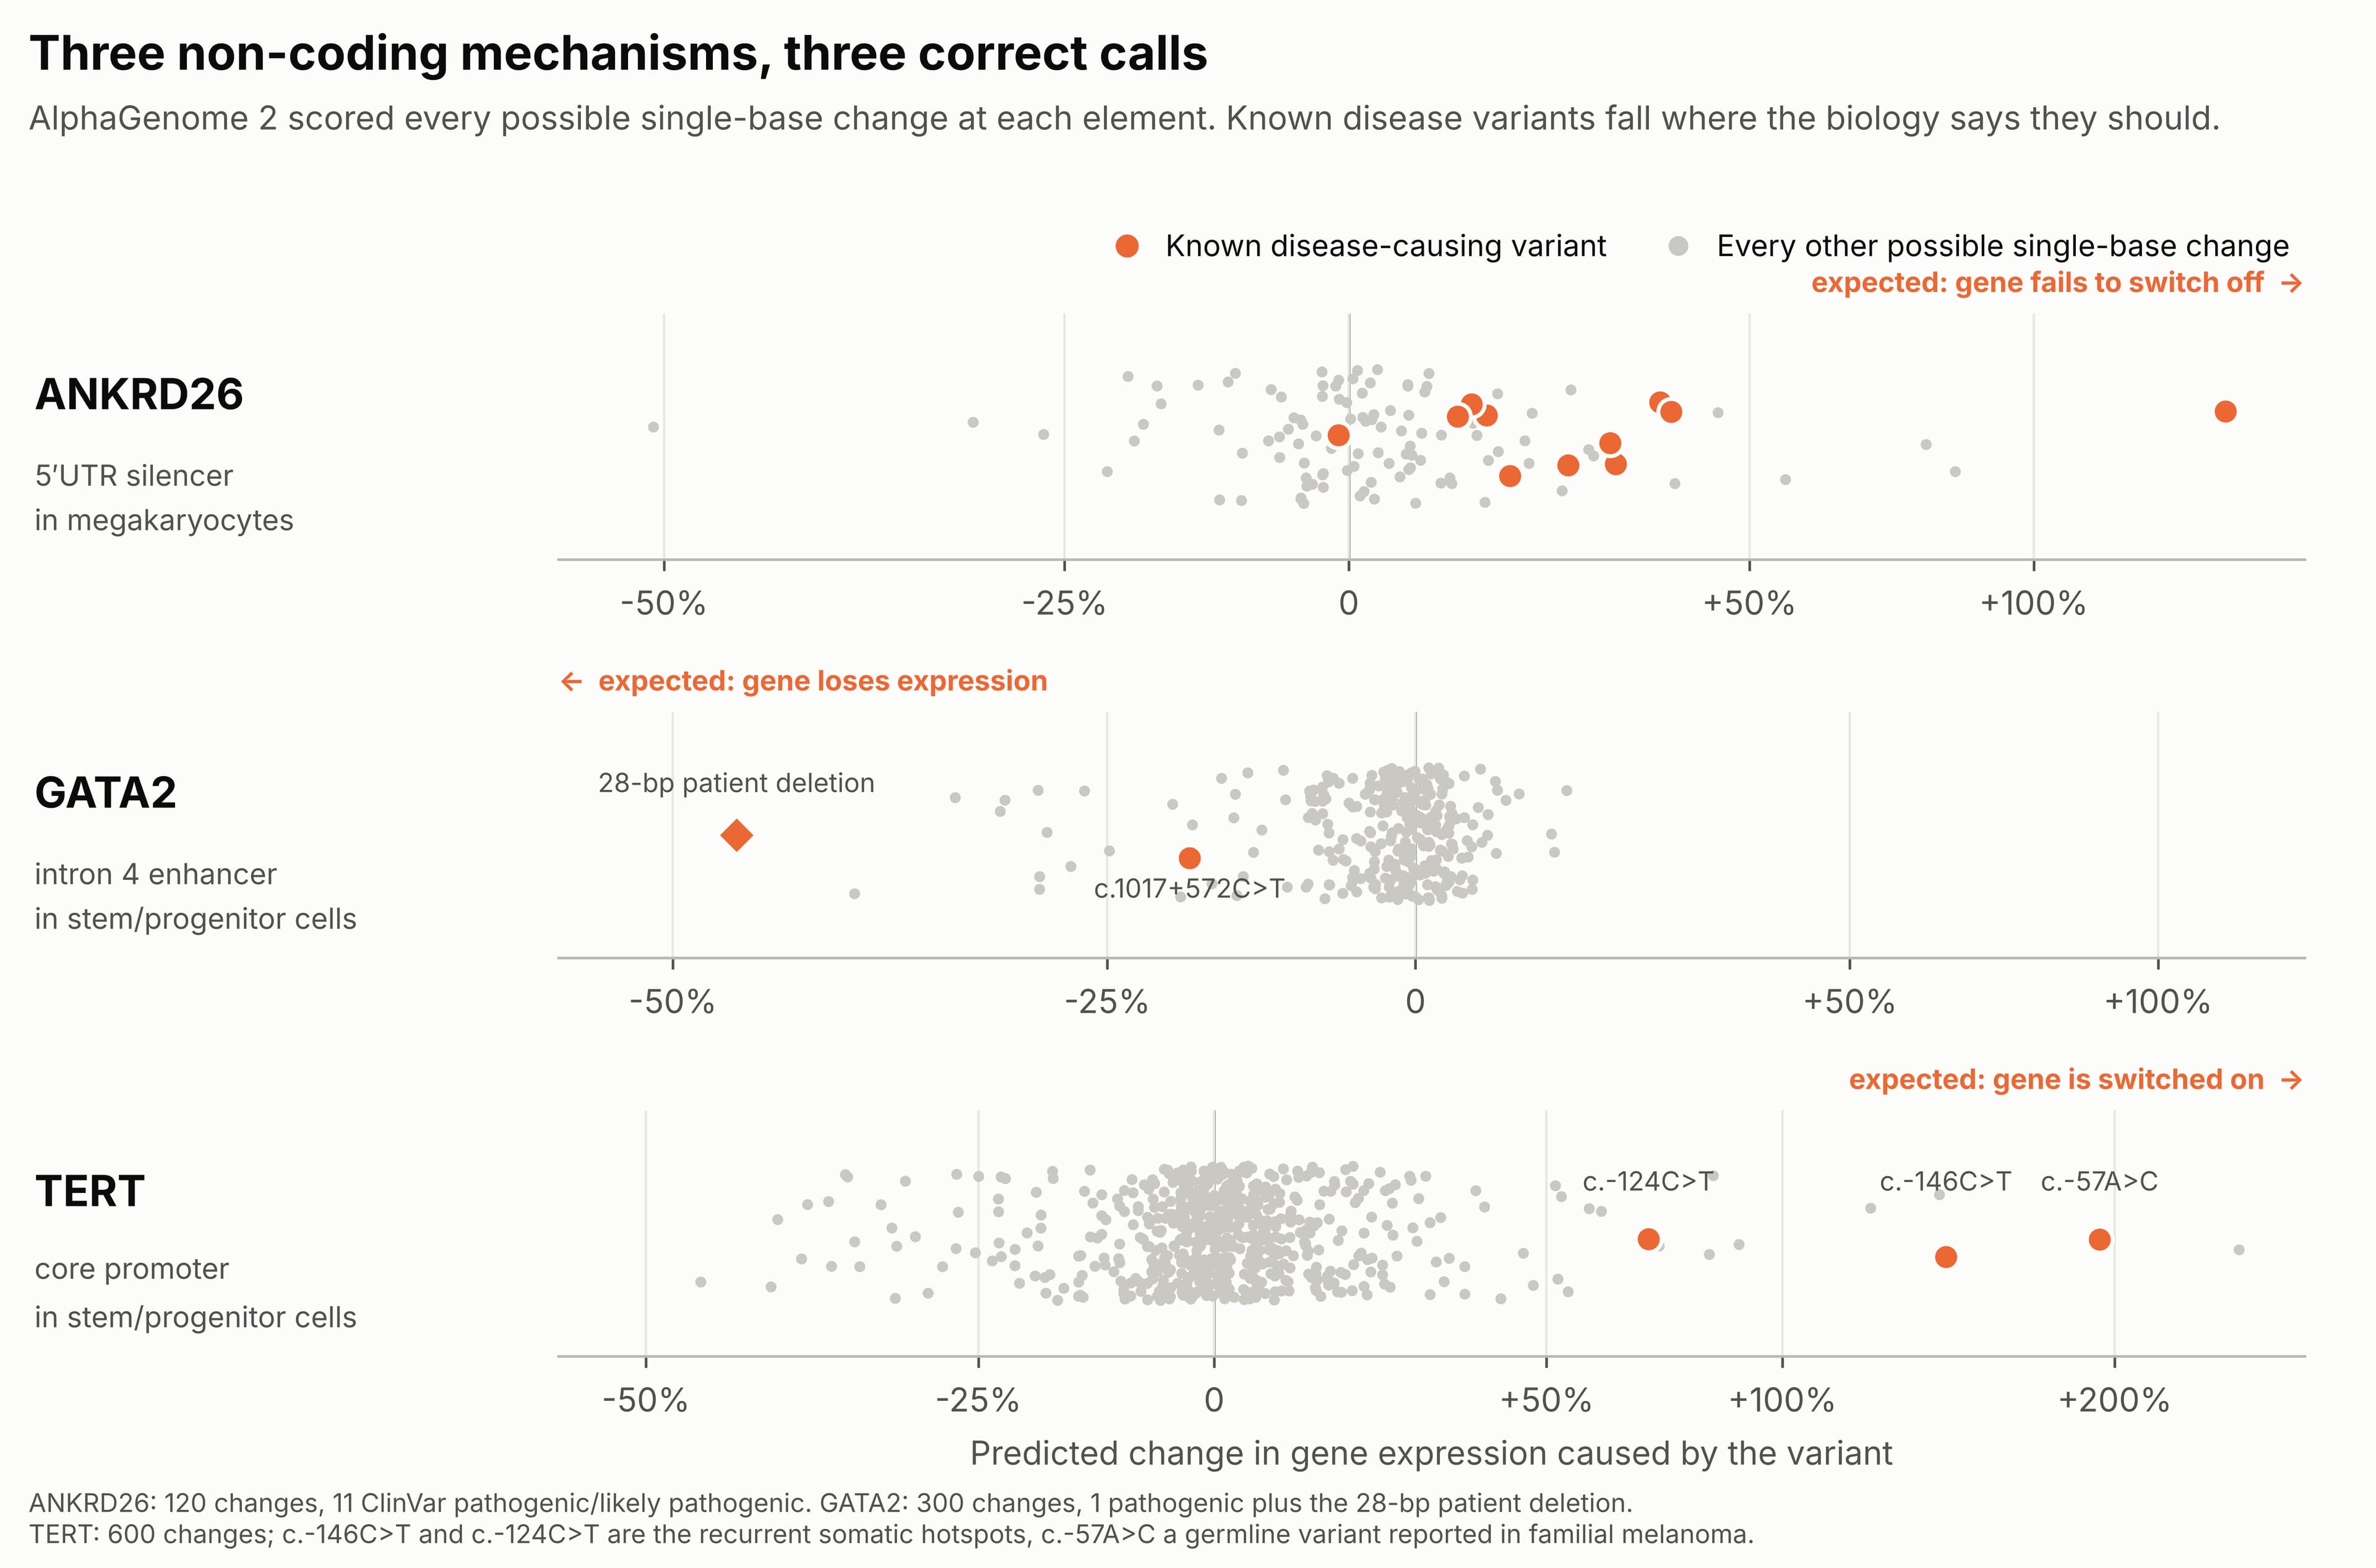
- ANKRD26. Ten of the 11 known pathogenic variants are predicted to raise expression in megakaryocytes, with a median increase of 25%. They separate from the other 81 scored changes with an AUROC of 0.88.
- GATA2. The one known pathogenic single-base variant, c.1017+572C>T, is predicted to lower expression by 19% in stem/progenitor cells, which puts it in the most damaging 5% of all 300 changes. The 28-base-pair deletion found in patients is predicted to lower it by 47%.
- TERT, an unplanned check. When we later scanned eight promoters, the two recurrent TERT promoter mutations (c.-124C>T and c.-146C>T, often called C228T and C250T) and the familial melanoma variant c.-57A>C ranked 10th, 3rd and 2nd of 600 for increasing expression. TERT was not part of the original design.
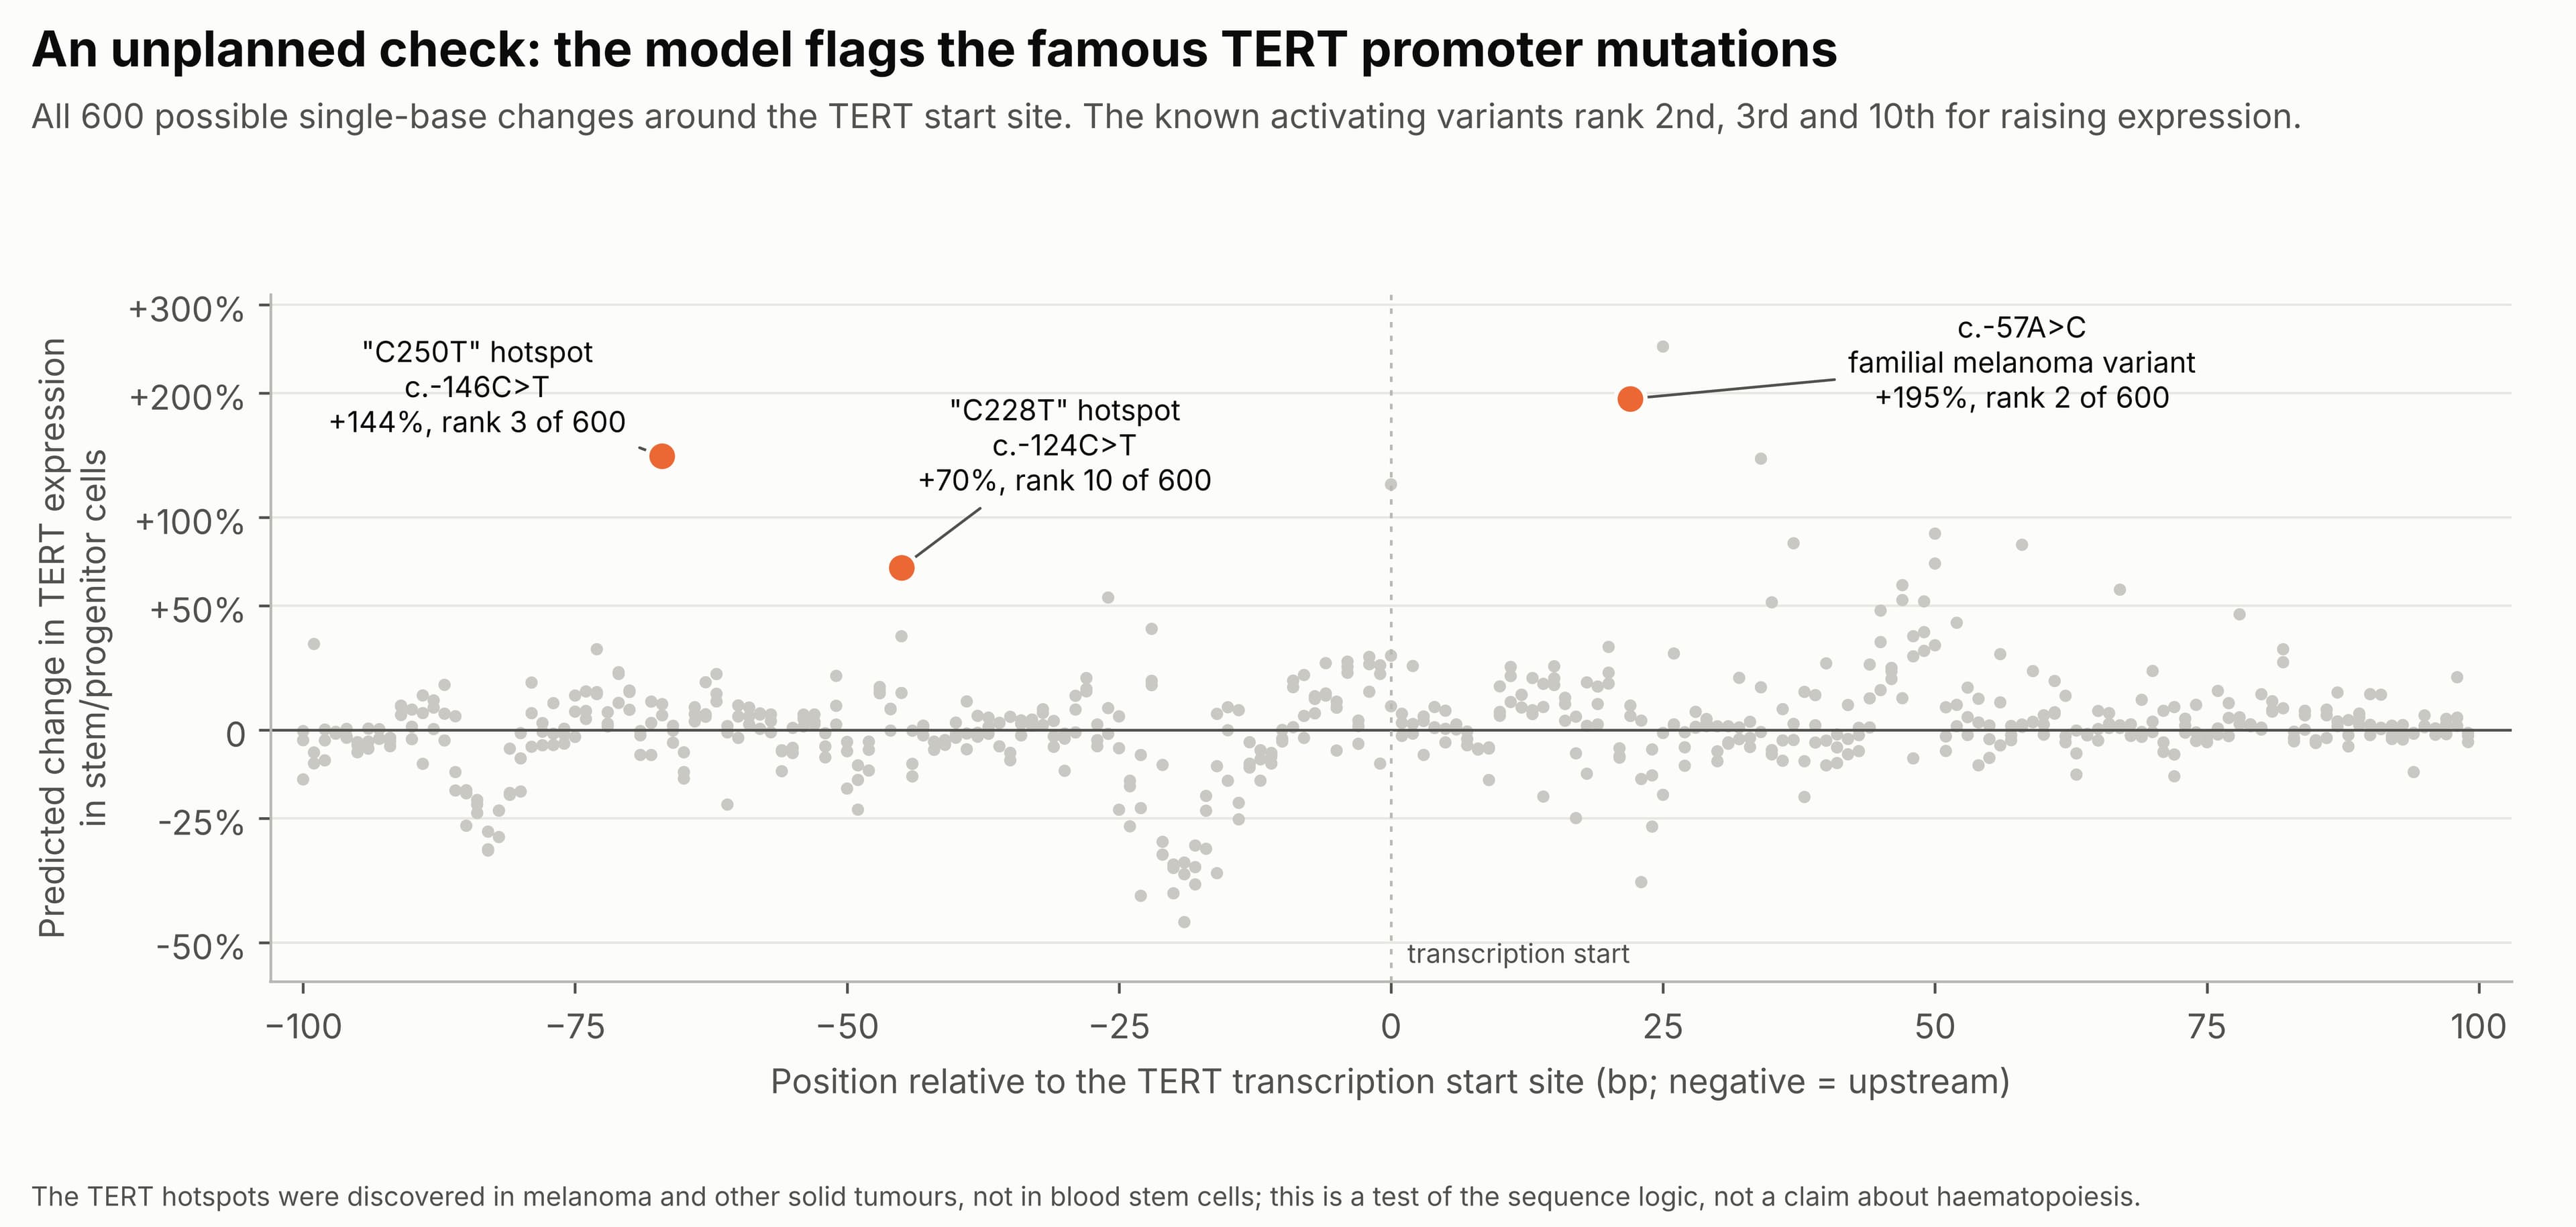
The model called three mechanisms correctly: A silencer broken, an enhancer broken, and an activating site created.
Result 2: cell type matters, with a caveat
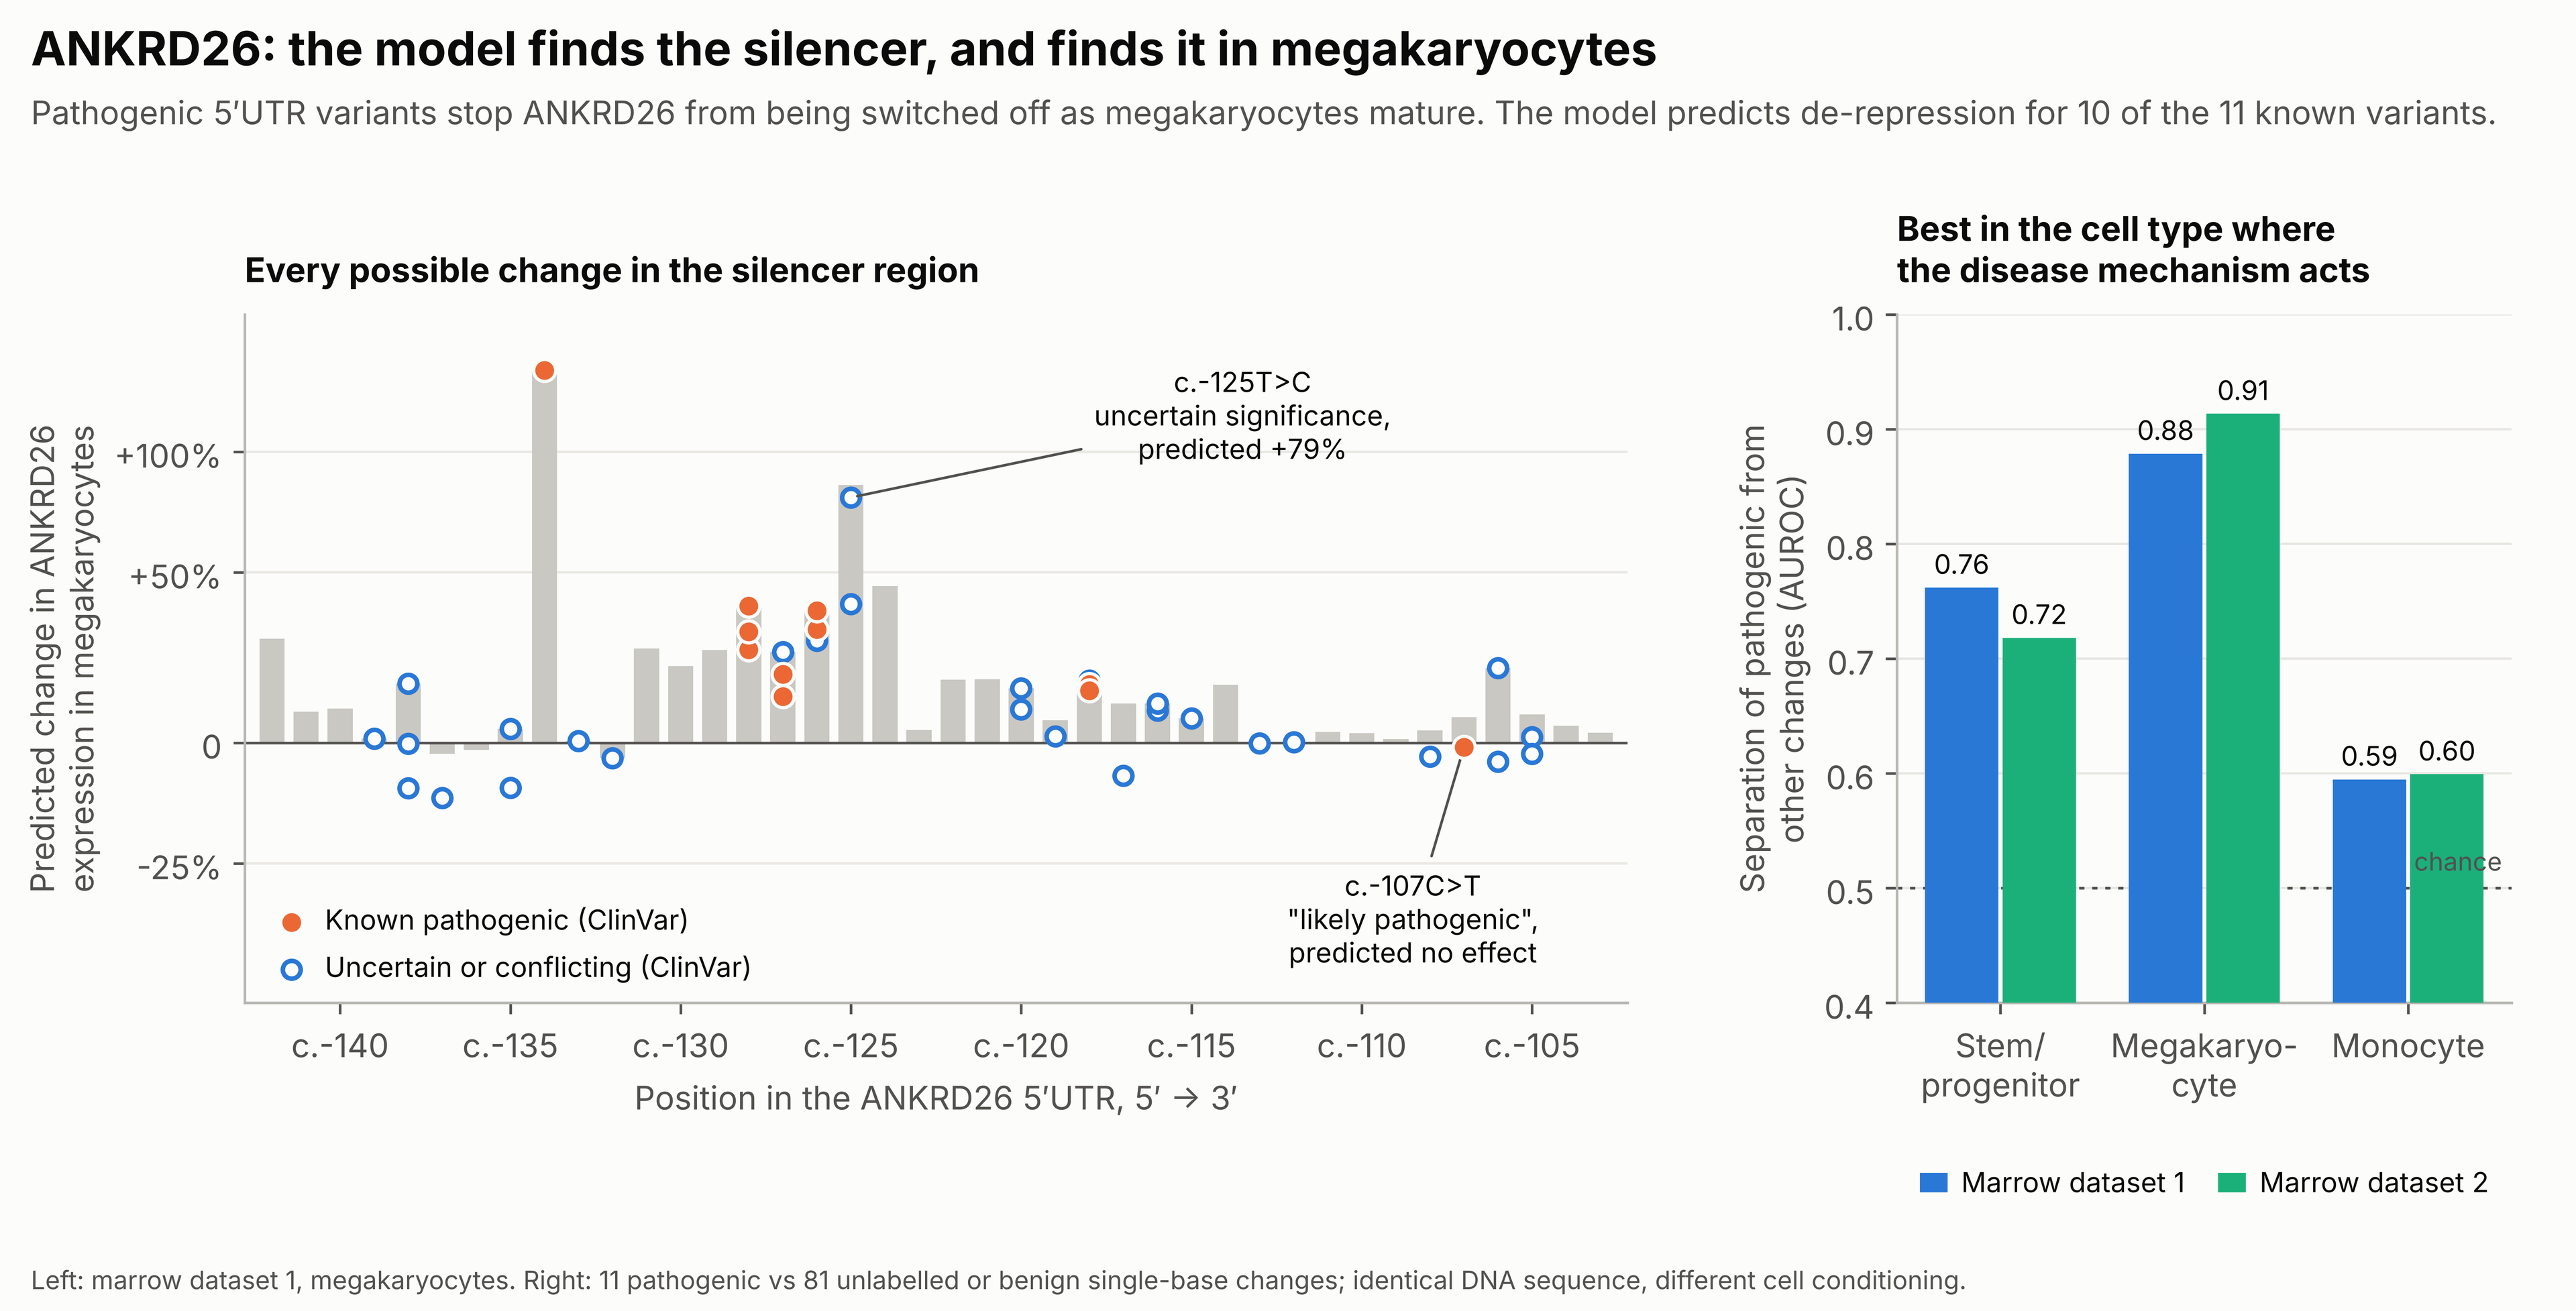
The DNA sequence is the same in every cell, but the model’s ability to pick out the ANKRD26 variants is not. Separation is best when the model is conditioned on megakaryocytes (0.88), weaker in stem/progenitor cells (0.76) and close to chance in monocytes (0.59). Megakaryocytes are where the disease mechanism operates.
We repeated the whole analysis with cells from a second, independent marrow dataset. The megakaryocyte result held (0.91), and variant-by-variant predictions agreed closely between the two datasets (rank correlation 0.87 for ANKRD26, 0.90 for GATA2).
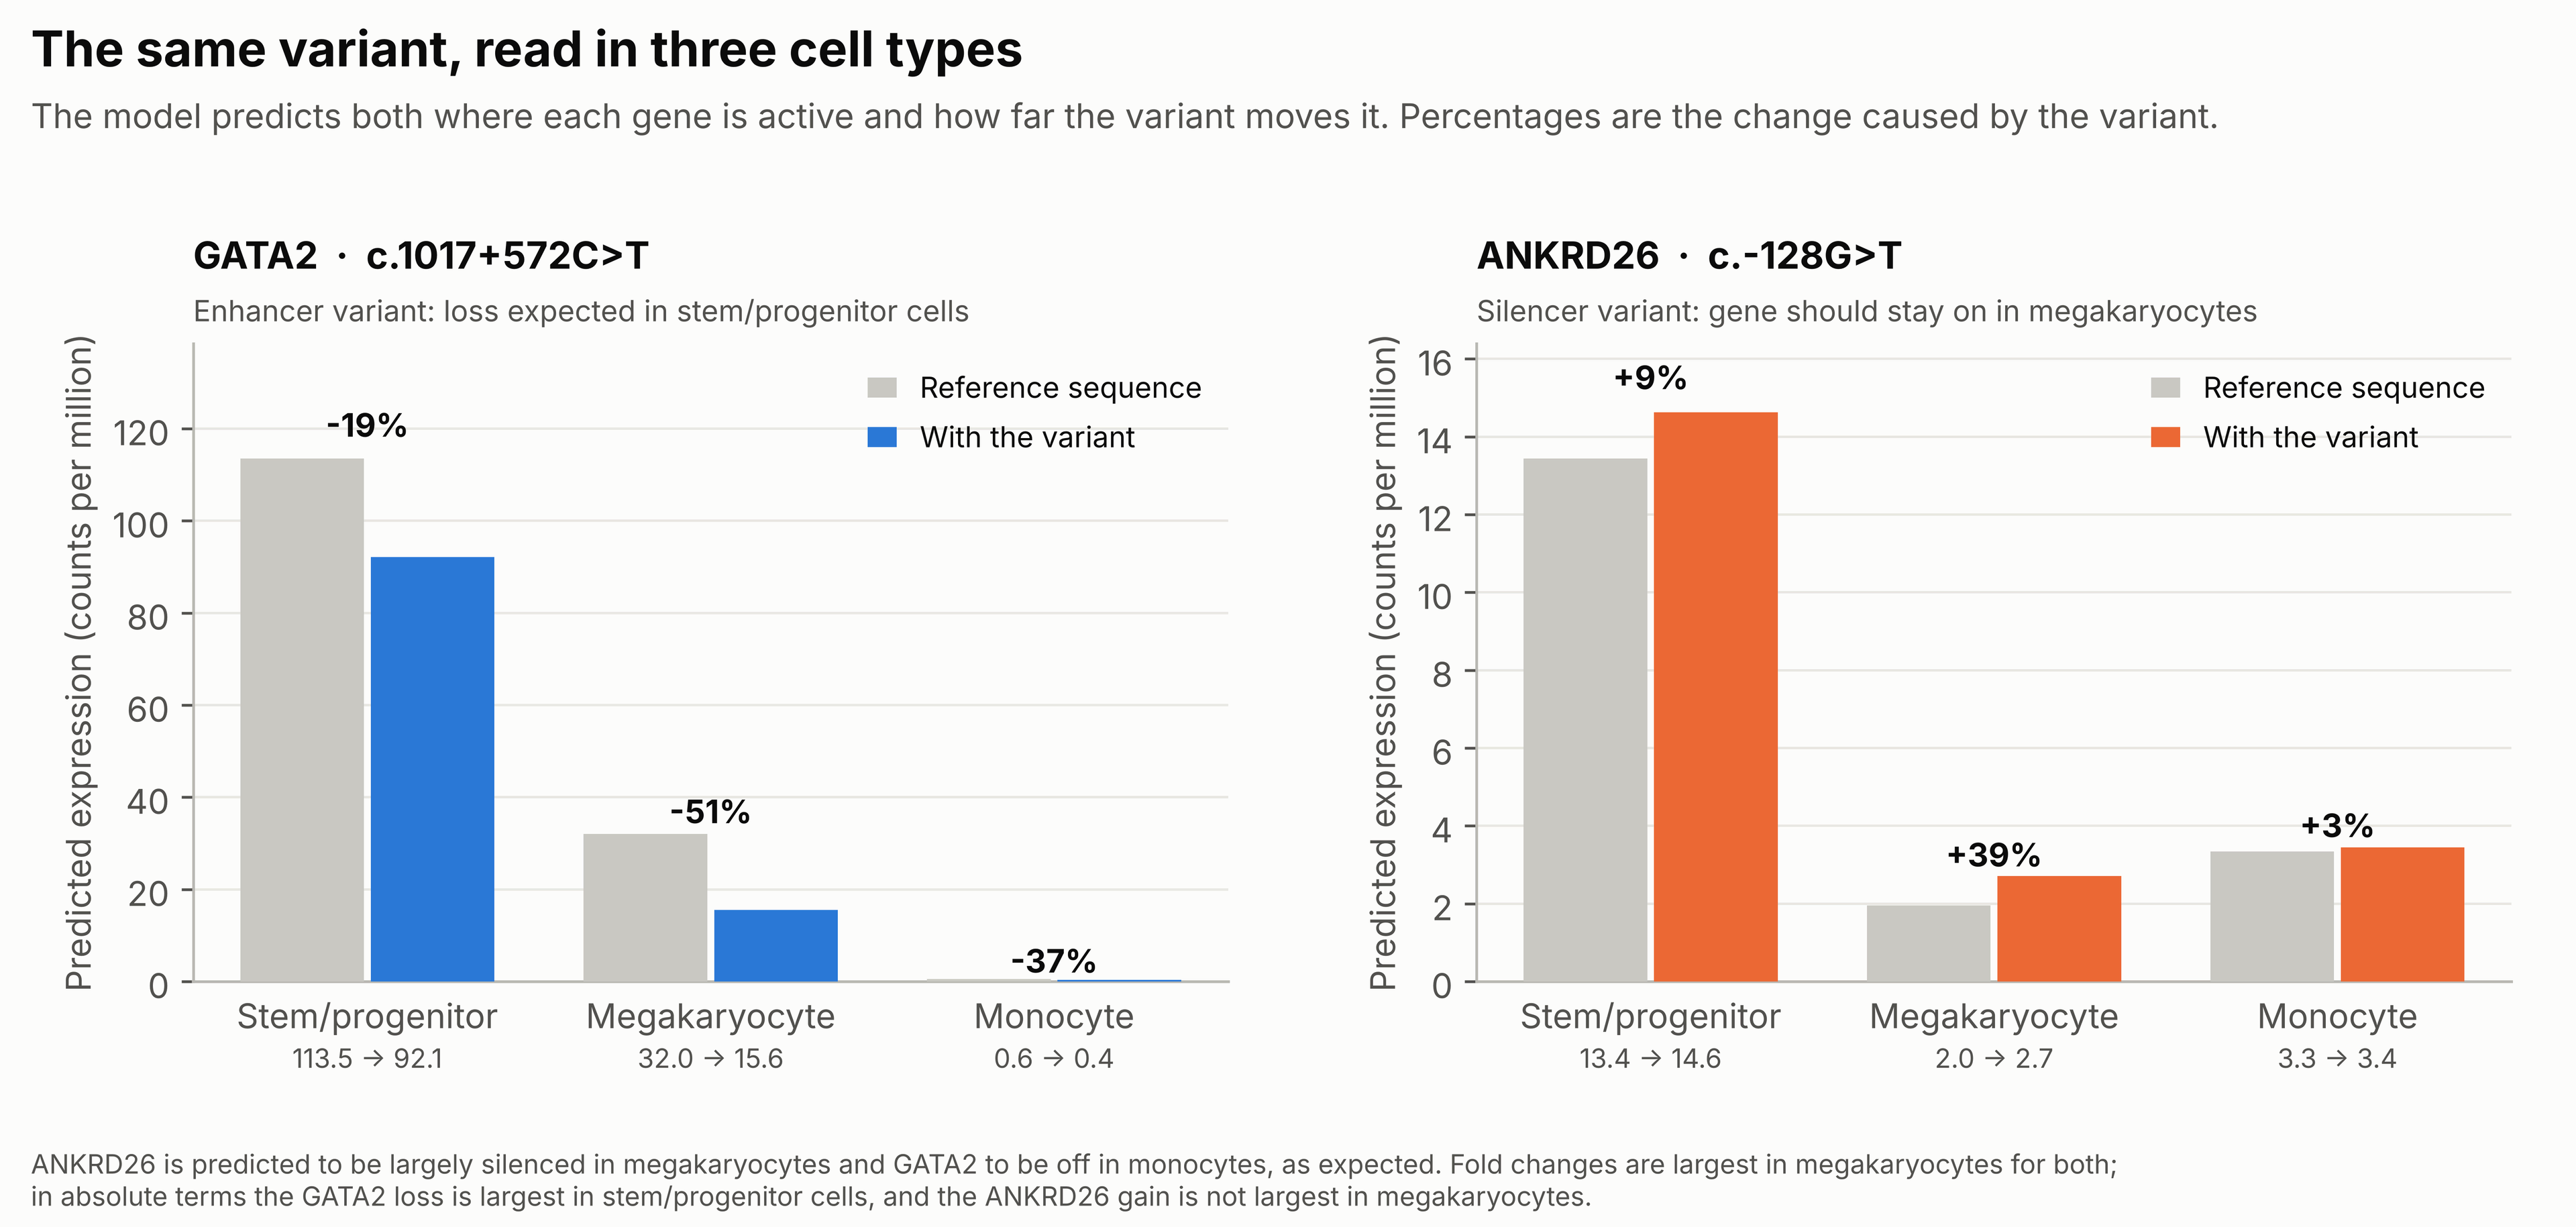
The model also gets the baseline right. It predicts that megakaryocytes have largely silenced ANKRD26 and that monocytes do not express GATA2. The caveat is about scale: the fold change from the ANKRD26 variant is largest in megakaryocytes, but because the gene is already low there, the absolute change is not. For GATA2, the absolute loss is largest in stem/progenitor cells, as expected.
Result 3: a map of the GATA2 enhancer, and predictions nobody has tested
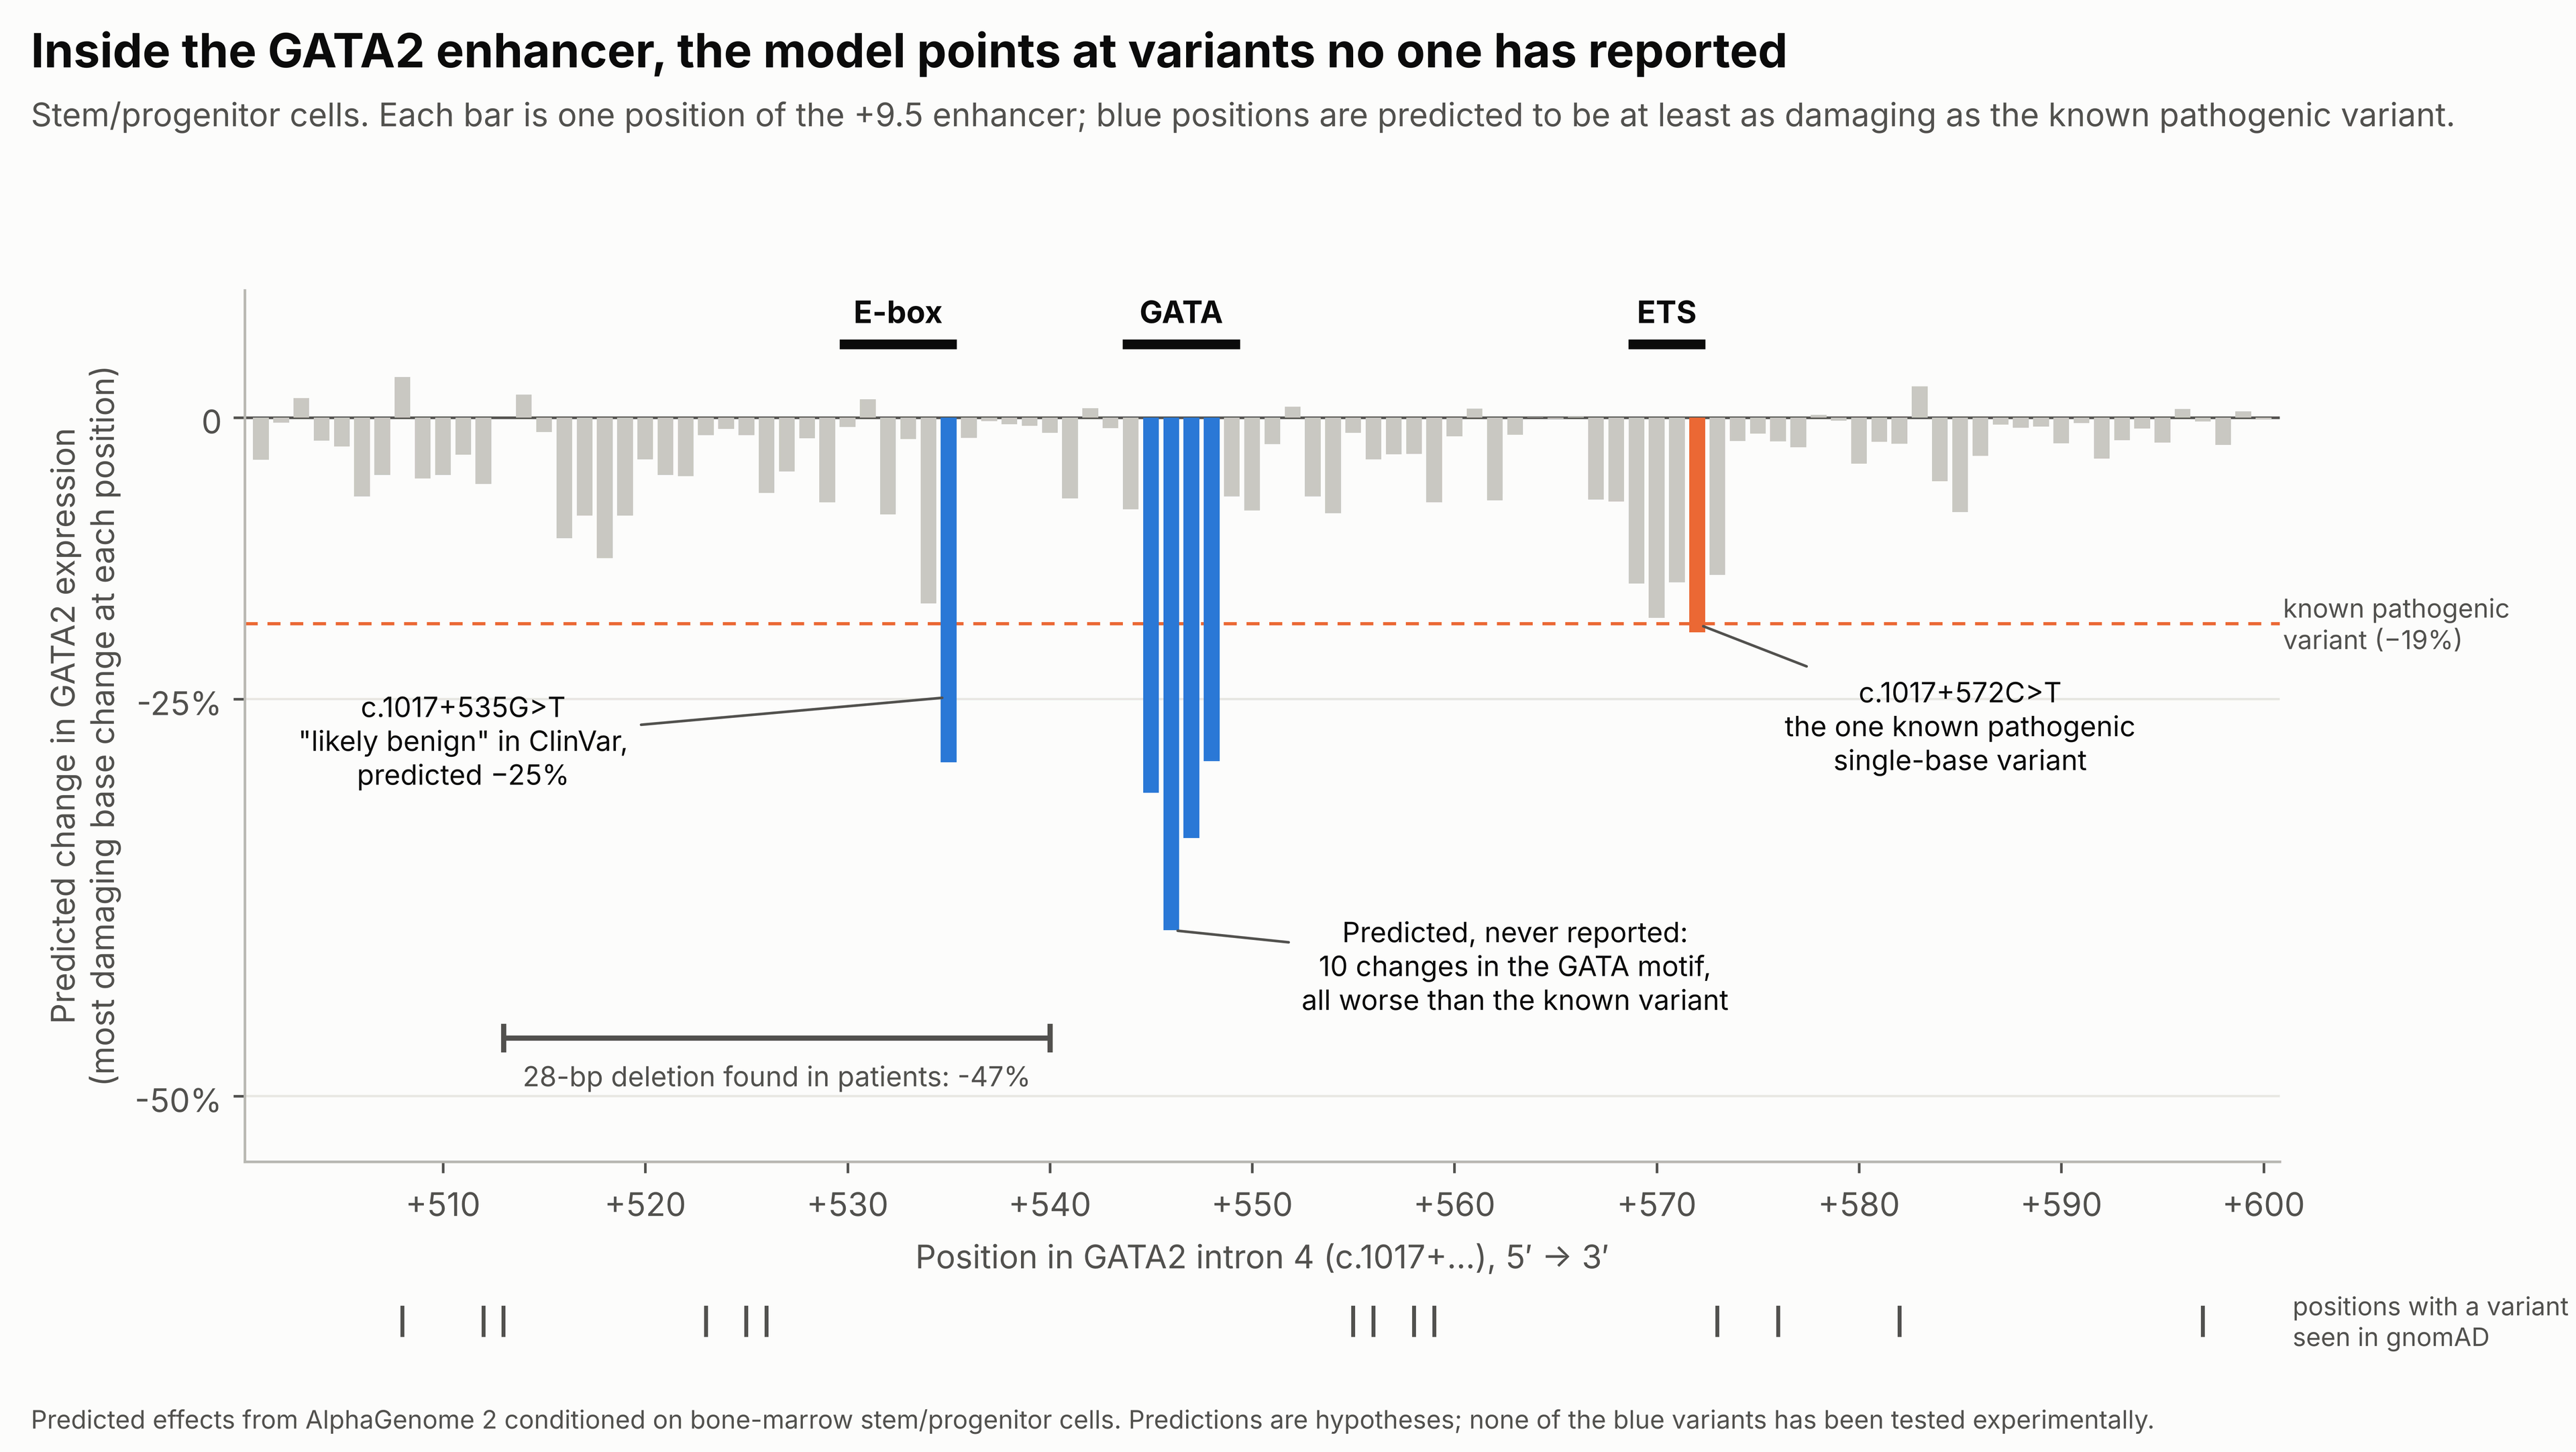
This is where the model adds something to what is already on record. The intron 4 enhancer contains three recognisable transcription-factor sites: An E-box, a GATA site and an ETS site. The known pathogenic single-base variant is in the ETS site, and the patient deletion spans the E-box.
The model ranks the GATA site as the most sensitive part of the element. Thirteen single-base changes that are not classified as pathogenic are predicted to reduce GATA2 expression at least as much as the known variant:
- Ten are in the GATA site (c.1017+545 to c.1017+548), with predicted losses of up to 41%. None is in ClinVar.
- Two are at one E-box position (c.1017+535). One of them, c.1017+535G>T, is currently listed in ClinVar as likely benign.
- One is a different base change at the known pathogenic position (c.1017+572C>A).
None of the thirteen has been observed in gnomAD. That is consistent with the prediction but does not confirm it: Only 16 of the 300 possible changes in this window appear in gnomAD at all, and the difference is not statistically significant (0 of the 30 most damaging versus 16 of the other 269, p = 0.18).
In the ANKRD26 5′UTR the same exercise flags an uncertain variant, c.-125T>C, as one of the strongest predicted effects (+79%), and suggests that c.-107C>T, listed as likely pathogenic, does nothing through this mechanism.
What the model did not do
- It did not beat older tools at finding the variants. CADD and evolutionary conservation separated the ANKRD26 variants almost as well (0.81 and 0.83 against 0.88). What they cannot provide is direction, cell type, or a ranking inside an element that is conserved from end to end.
- Conditioning on our own single-cell data gave no clear advantage over the model’s built-in marrow cell types.
- Population data did not validate the predictions. Across 4,800 promoter variants in eight genes, high-impact predictions were not depleted from gnomAD. CADD and conservation were not either, so this test probably lacks sensitivity in these regions.
- GATA2 rests on one known single-base variant. Its result is a rank, not a statistic.
- The model only reads transcription. In the DDX41 promoter window, nine pathogenic variants at the start codon, the first splice site and early stop codons scored near zero, as they should for a model of transcriptional regulation.
What this means in practice for a hematologist
- At elements where the mechanism is known, AlphaGenome 2 reproduces it, in the right direction, and the result is stable across independent cell datasets.
- That makes it reasonable to use as a triage tool for non-coding variants in myeloid predisposition genes: a way to decide which uncertain variants deserve a reporter assay or a closer look at the family.
- It is not evidence for classification. The GATA-site variants are predictions. The disagreement with ClinVar over c.1017+535G>T is a reason to re-examine that entry, not to overturn it.
The most useful next step is a reporter assay of the GATA-site and E-box variants in a haematopoietic cell line, alongside the known pathogenic variant as a control.
Methods in brief
- Model: AlphaGenome 2 through the public API, 1 Mb sequence context, gene-level expression change for each variant (natural-log fold change, verified against the model’s predicted expression values).
- Cells: raw single-cell RNA counts from two public bone-marrow datasets (CELLxGENE Census). Megakaryocyte-labelled cells were filtered for platelet-monocyte aggregates before use.
- Variants: in-silico saturation mutagenesis of chr10:27,100,429–27,100,468 (ANKRD26) and chr3:128,483,260–128,483,359 (GATA2), GRCh38; a 200-bp window around the canonical transcription start site for the eight-gene promoter panel.
- Labels and comparators: ClinVar (queried November 2026), gnomAD v4, CADD v1.7, phyloP 100-way, JASPAR 2022 motifs.
- Statistics: AUROC of pathogenic versus unlabelled or benign single-base changes, with label-permutation p-values (ANKRD26 p < 0.001).
Comments